11 Nanopore WGS Assembly (metaflye)
11.1 Assembly
Metagenomic assemblies can help you recover genes and pathways present in a community. They can also be fed into community analysis. On the other hand, you can miss some of the more rare members of the community.
Let’s do an assembly of the Oxford Nanopore (ONT) reads from the red alder nodules. We will use the reads that have had red alder removed so we are only assembling the microbes. We’ll use the metagenomics module of the Flye assembler.
Make sure you are in a screen.
Create a directory called nodule-assembly-3469-3 in your home directory. Then go into it.
Activate the environment.
Assemble the metagenome with metaFlye. Don’t forget the dot at the end. That tells the program to put the output in the current directory.
11.2 Assembly Completeness and Contamination
We will feed in the whole assembly since it is mostly Frankia but later you will learn how to bin your assembly into the different organisms that it represents.
CheckM allows you to assess completeness and contamination of MAGs (Metagenome-assembled genomes). It is in the same environment (flye).
CheckM puts each of your sequences in a phylogenetic tree (if needed) and then looks for single-copy genes that should be in each sequence. The percentage of expected genes it finds is a measure of completeness. The number or multi-copy genes it finds are a measure of contamination (the presence of closely related or more distantly related organisms in your bin).
CheckM
https://www.ncbi.nlm.nih.gov/pmc/articles/PMC4484387/pdf/1043.pdf
https://ecogenomics.github.io/CheckM/
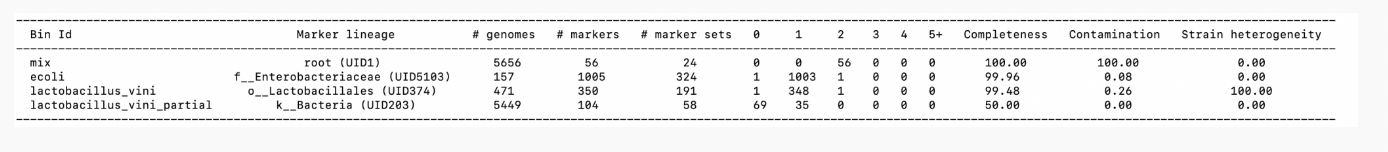
Here is a test output using 2 genomes from NCBI, a partial genome of one of them, and the 2 genomes catted together.
Video explanation:
https://onestopdataanalysis.com/checkm-completeness-contamination/
CheckM at the genus level. We will use taxonomy_wf (wf stands for workflow) which allows us to feed in the Frankia genus that we know is there.
checkm taxonomy_wf [parameters]
The parameters we will use:
-x extension (extension of the assembly bins, ie fasta; checkm will run on all the files in the assembly_bin_dir that have that extension)
-t number of threads
-f output file (default: STDOUT)
For additional parameters:
checkm taxonomy_wf -x fasta -t 8 -f ./3469-3_tax_results.txt genus Frankia ~/nodule-assembly-3469-3 ./checkmNote: You can also use the lineage workflow (lineage_wf) if you don’t know your taxa. It will place sequences on a tree and calculate their lineages.
Plot the genome completeness, contamination and strain heterogeneity stats.
checkm marker_plot [parameters]
The parameters we will use:
-x extension (extension of the assembly bins, ie fasta; checkm will run on all the files in the assembly_bin_dir that have that extension)
–image_type format of image (eps,pdf,png,ps,or svg; default: png)
–dpi
–font_size
–height
checkm marker_plot -x fasta --image_type png --dpi 600 --font_size 14 --height 5 \
~/nodule-assembly-3469-3/checkm ~/nodule-assembly-3469-3 ~/nodule-assembly-3469-3/checkm
Let’s look at the assembly metrics generated by checkM.
Deactivate the environment.
Download the marker_plot to your computer using filezilla and take a look at it.
Note: You can also classify the assembly contigs using KrakenUniq or Centrifuge. Some of the rare organisms will have some reads but not enough to assemble, so you might lose some of the rarer taxa.