Chapter 5 Read Processing (ONT)
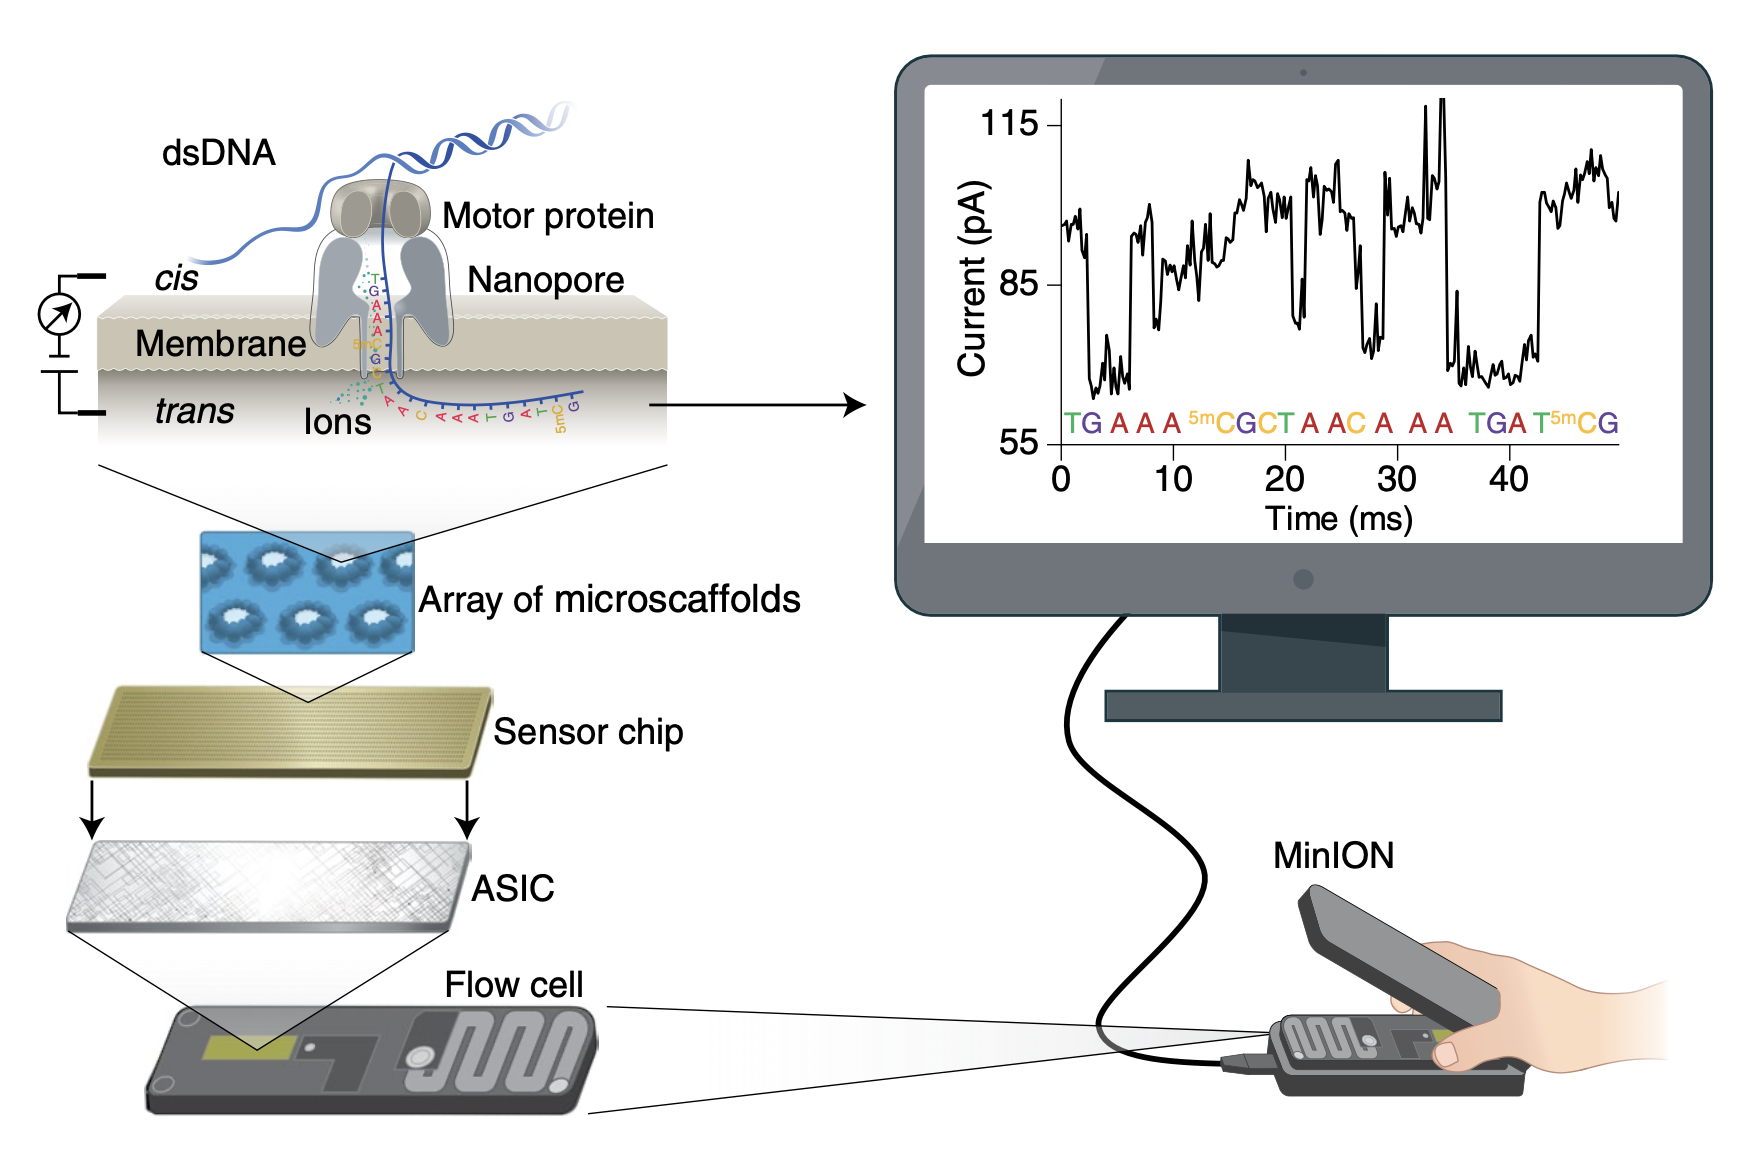
5.1 Oxford Nanopore Sequencing (ONT)
5.2 Filter Host DNA

In order to focus on sequencing reads from the microbes in the nodule, we will filter out reads that align to the red alder genome as follows:
- Align the fastq-formatted reads to the red alder genome using minimap2.
- Extract reads that do not align to red alder and sort them using samtools.
- Create a fastq file with only the unaligned reads using samtools bam2fastq.
- Compress the fastq file using gzip.
5.2.1 Setup
Activate the environment that contains minimap2 and samtools

Make a directory and go into it
Link to the merged minion reads
5.2.2 Alignment
Run Minimap2 to align the MinION reads to the red alder genome
- The -x map-ont parameter (allows ~10% error + divergence)
5.2.3 Get microbial reads
Now we will use samtools, which is available in the same environment, to pull out reads that didn’t align to red alder.
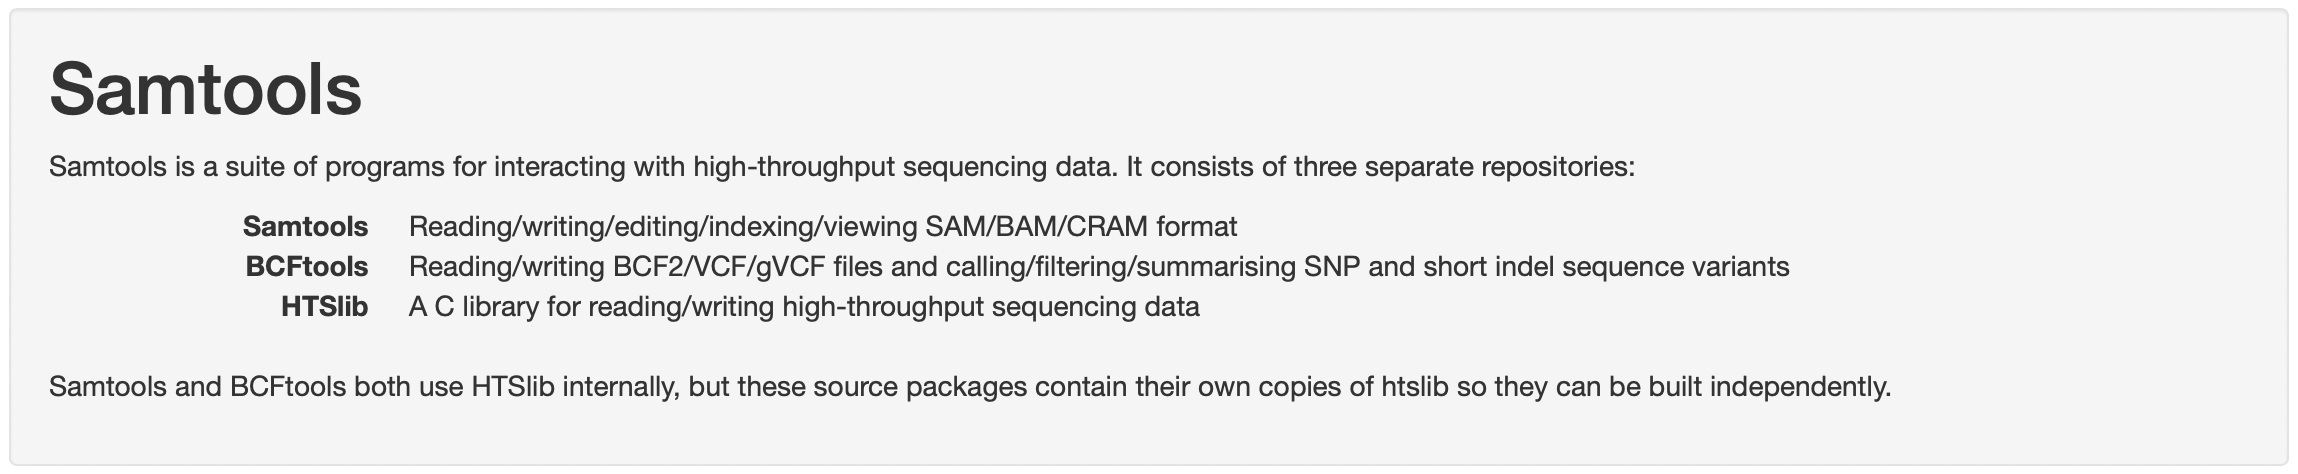
Convert the unmapped reads in the alignment file (sam) to a fastq file
- The -f4 includes only reads with the 4 flag (unmapped)
Compress the new fastq file
- (note that it will automatically add the extension .gz)
5.3 Quality Control
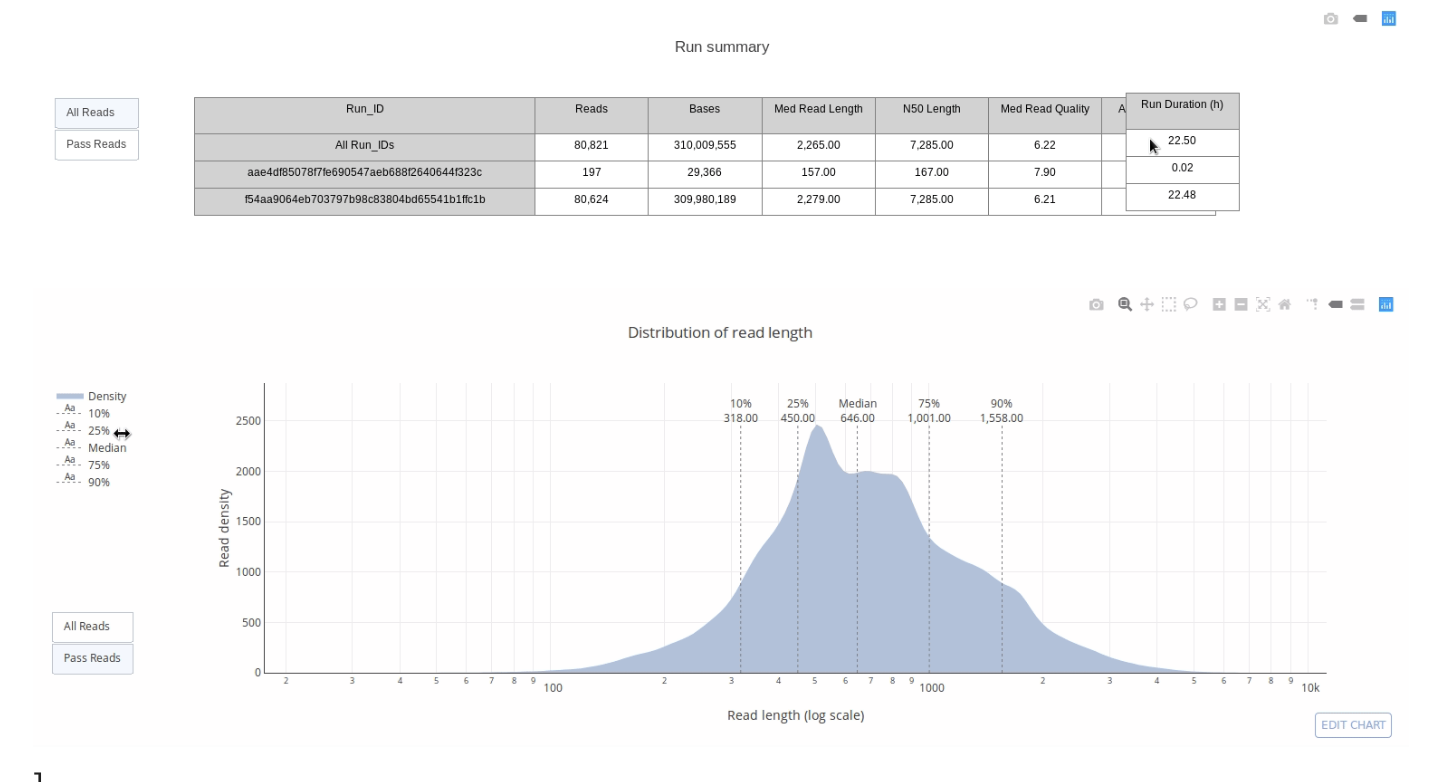
- “PycoQC computes metrics and generates interactive QC plots for Oxford Nanopore technologies sequencing data” (https://a-slide.github.io/pycoQC/ )

- What do we need in order to run a Quality Control Check?
- Sequencing Summary File
- Automatically produced by the MinIon basecaller.
- PycoQC package + dependencies
- Already downloaded for you in Ghostwheel.
- Line of code to produce .html file.
- Line of code to secure copy file to your computer.
5.3.2 PycoQC package & code
- Where is it? How to activate it?
- Log in to Ghostwheel
- Stay in your home directory (check with pwd)
- Type the following:
5.3.3 Secure Copy
- What terminal to copy from? What is the code?
- Open new Terminal window but don’t connect to the linux server
- Type:
5.3.4 Open your URL
Find your file on your desktop.
Double-click to open, or right-click to select browser
5.3.5 Normalization
With normalization we are trying to get the correct relative gene expression abundances between cells.
Gene expression between cells is based on count data.
What does a count in a count matrix represent?
- mRNA Capture
- Reverse transcription of mRNA
- sequencing of a molecule of mRNA
The most common normalization protocol is:
- count depth scaling
- aka CPM or counts per million
- it assumes that all cells in the dataset initially contain an equal number of mRNA molecules
- it assumes that count depth differences arise from sampling
Normalize complete
- But wait!
- We still have unwanted variability in the data.
- What kind of unwanted variability?
- What is the solution? Data Correction.
5.3.6 Data correction and integration
Biological Covariates
- Cell-Cycle effects
- Batch
- Dropout
Which Covariates to Consider?
- Depends on downstream analysis
- Correct for biological and technical to be considered separately
- Corrections are used for different purposes
- Each approach to correction presents unique challenges
What are the Correction methods?
- Regressing out biological effects
- Regressing out technical effects
- Batch effects and data integration
- Expression recovery