Chapter 2 Metagenomics overview
2.1 Metagenomics and Metatranscriptomics
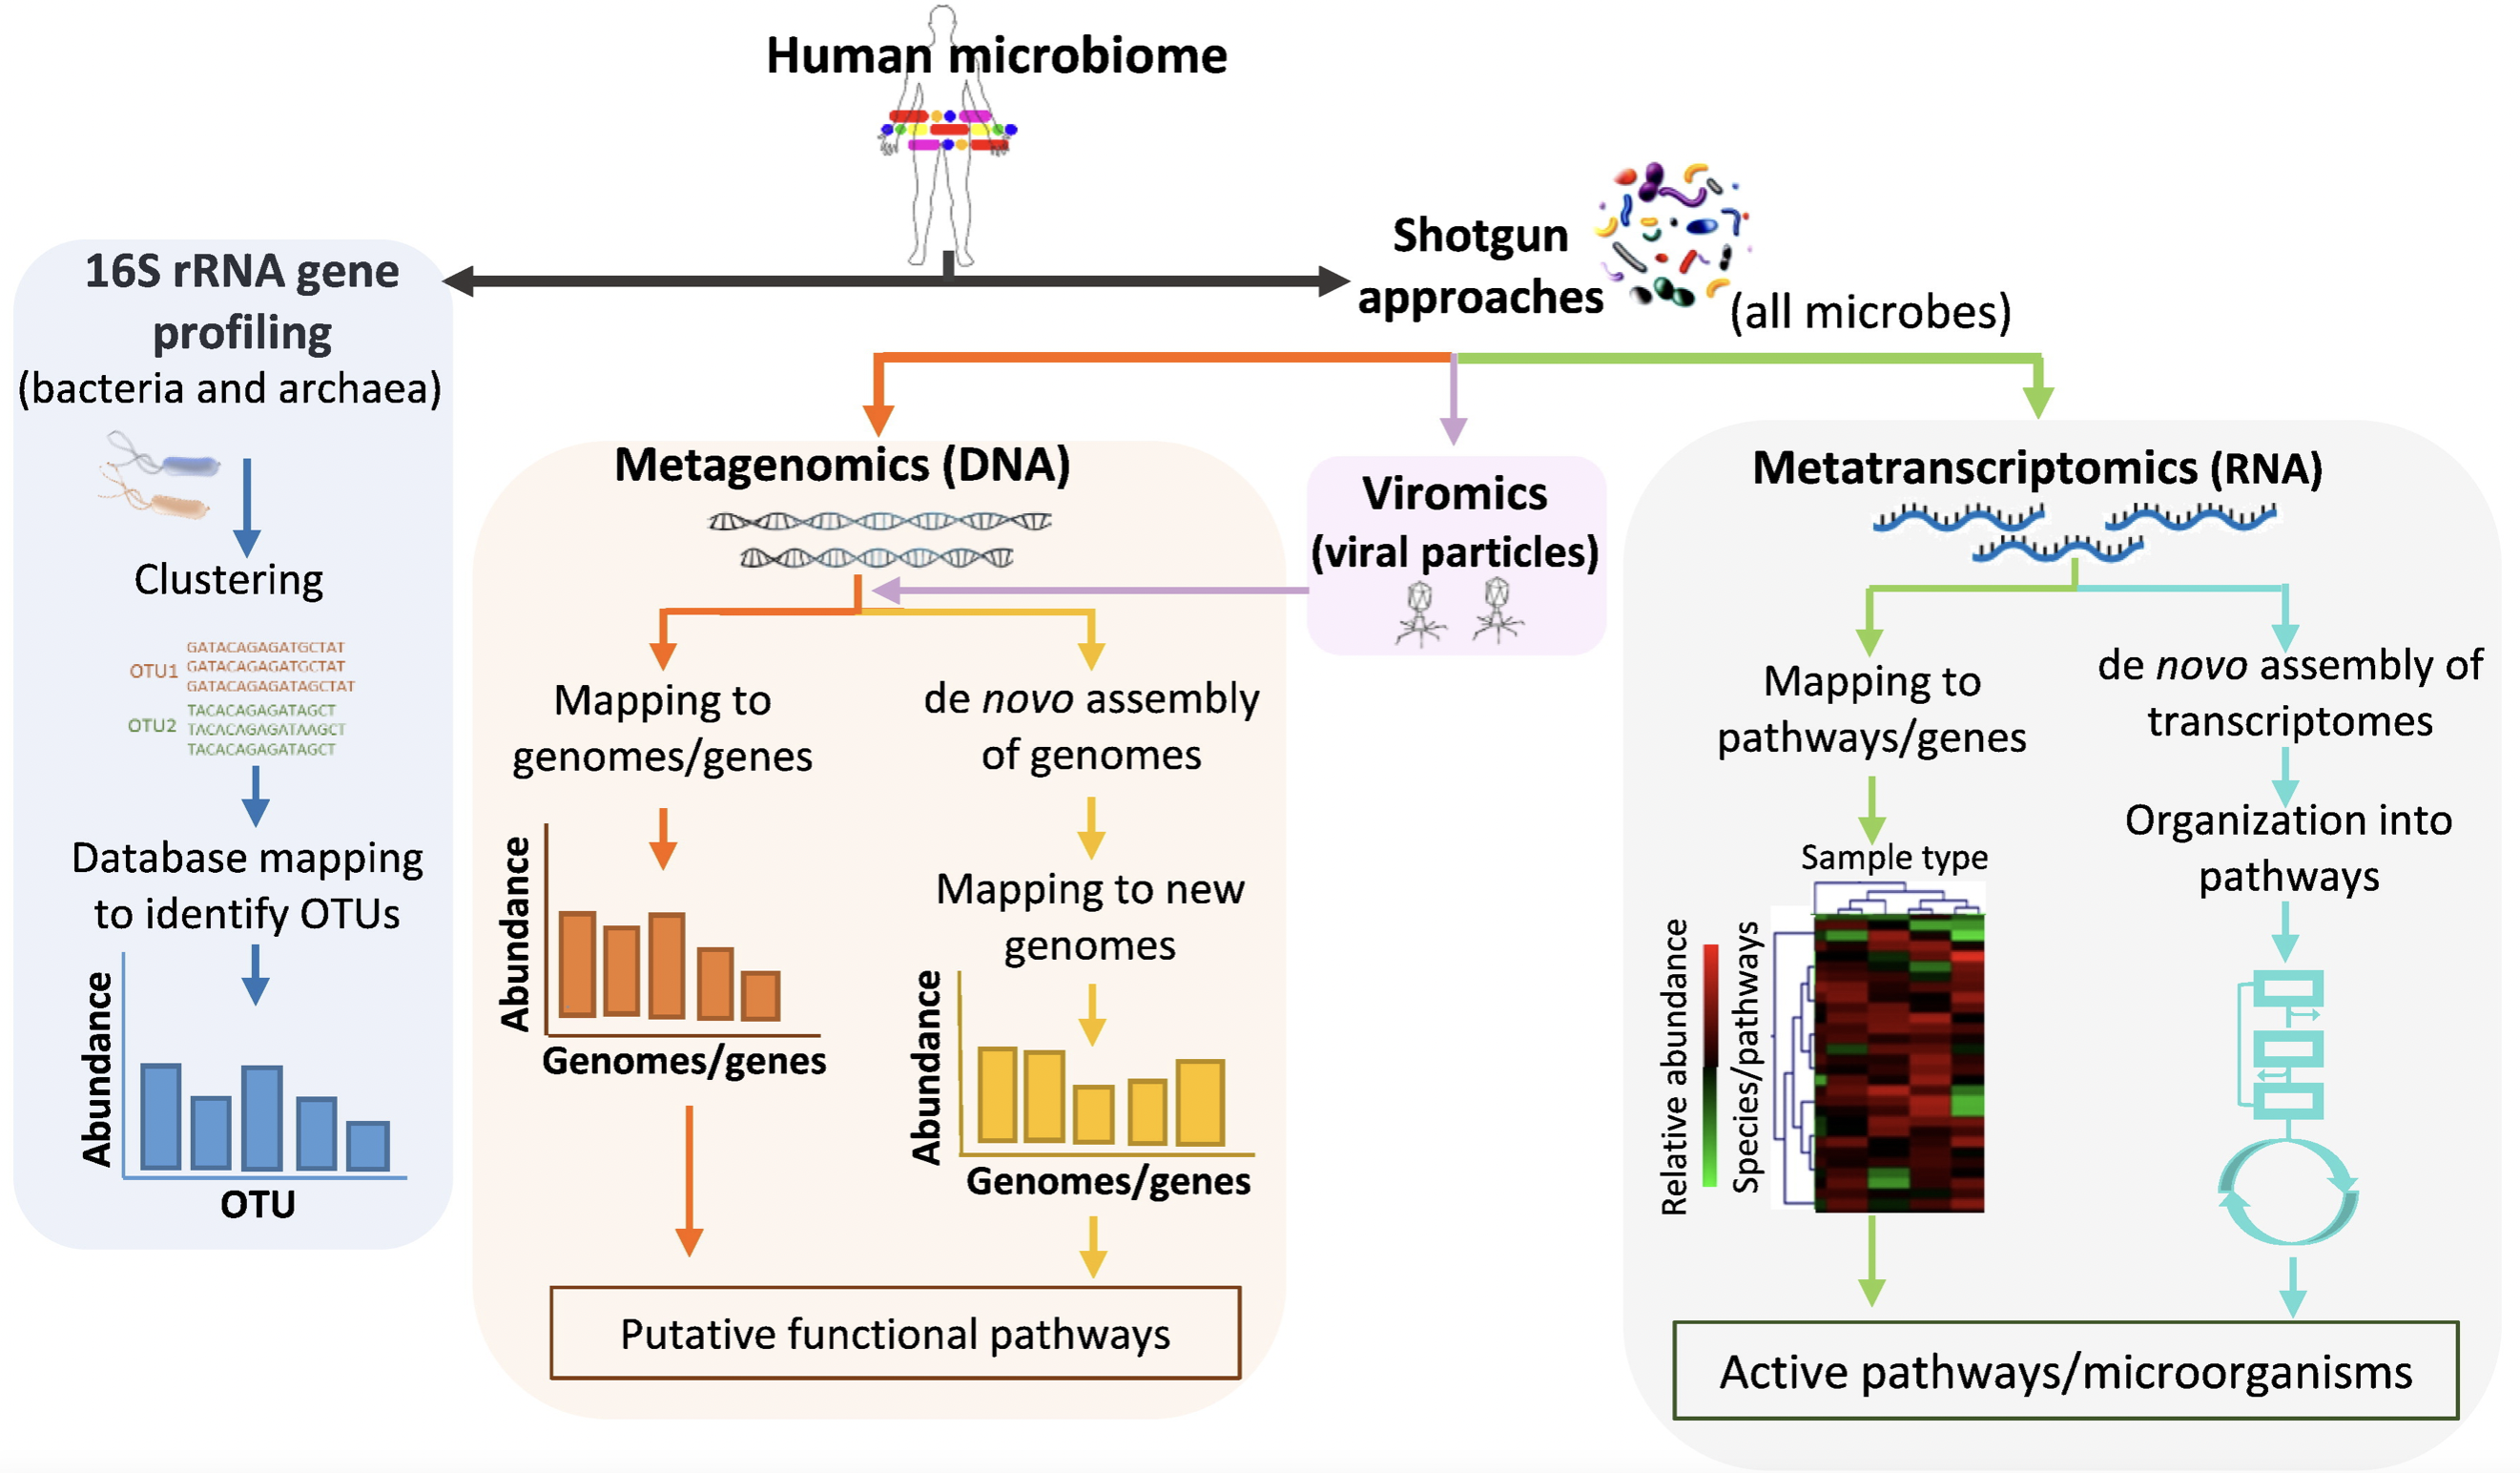
Bikel, S., Valdez-Lara, A., Cornejo-Granados, F., Rico, K., Canizales-Quinteros, S., Soberón, X., … & Ochoa-Leyva, A. (2015). Combining metagenomics, metatranscriptomics and viromics to explore novel microbial interactions: towards a systems-level understanding of human microbiome. Computational and structural biotechnology journal, 13, 390-401.

2.1.2 Shotgun Metagenomics
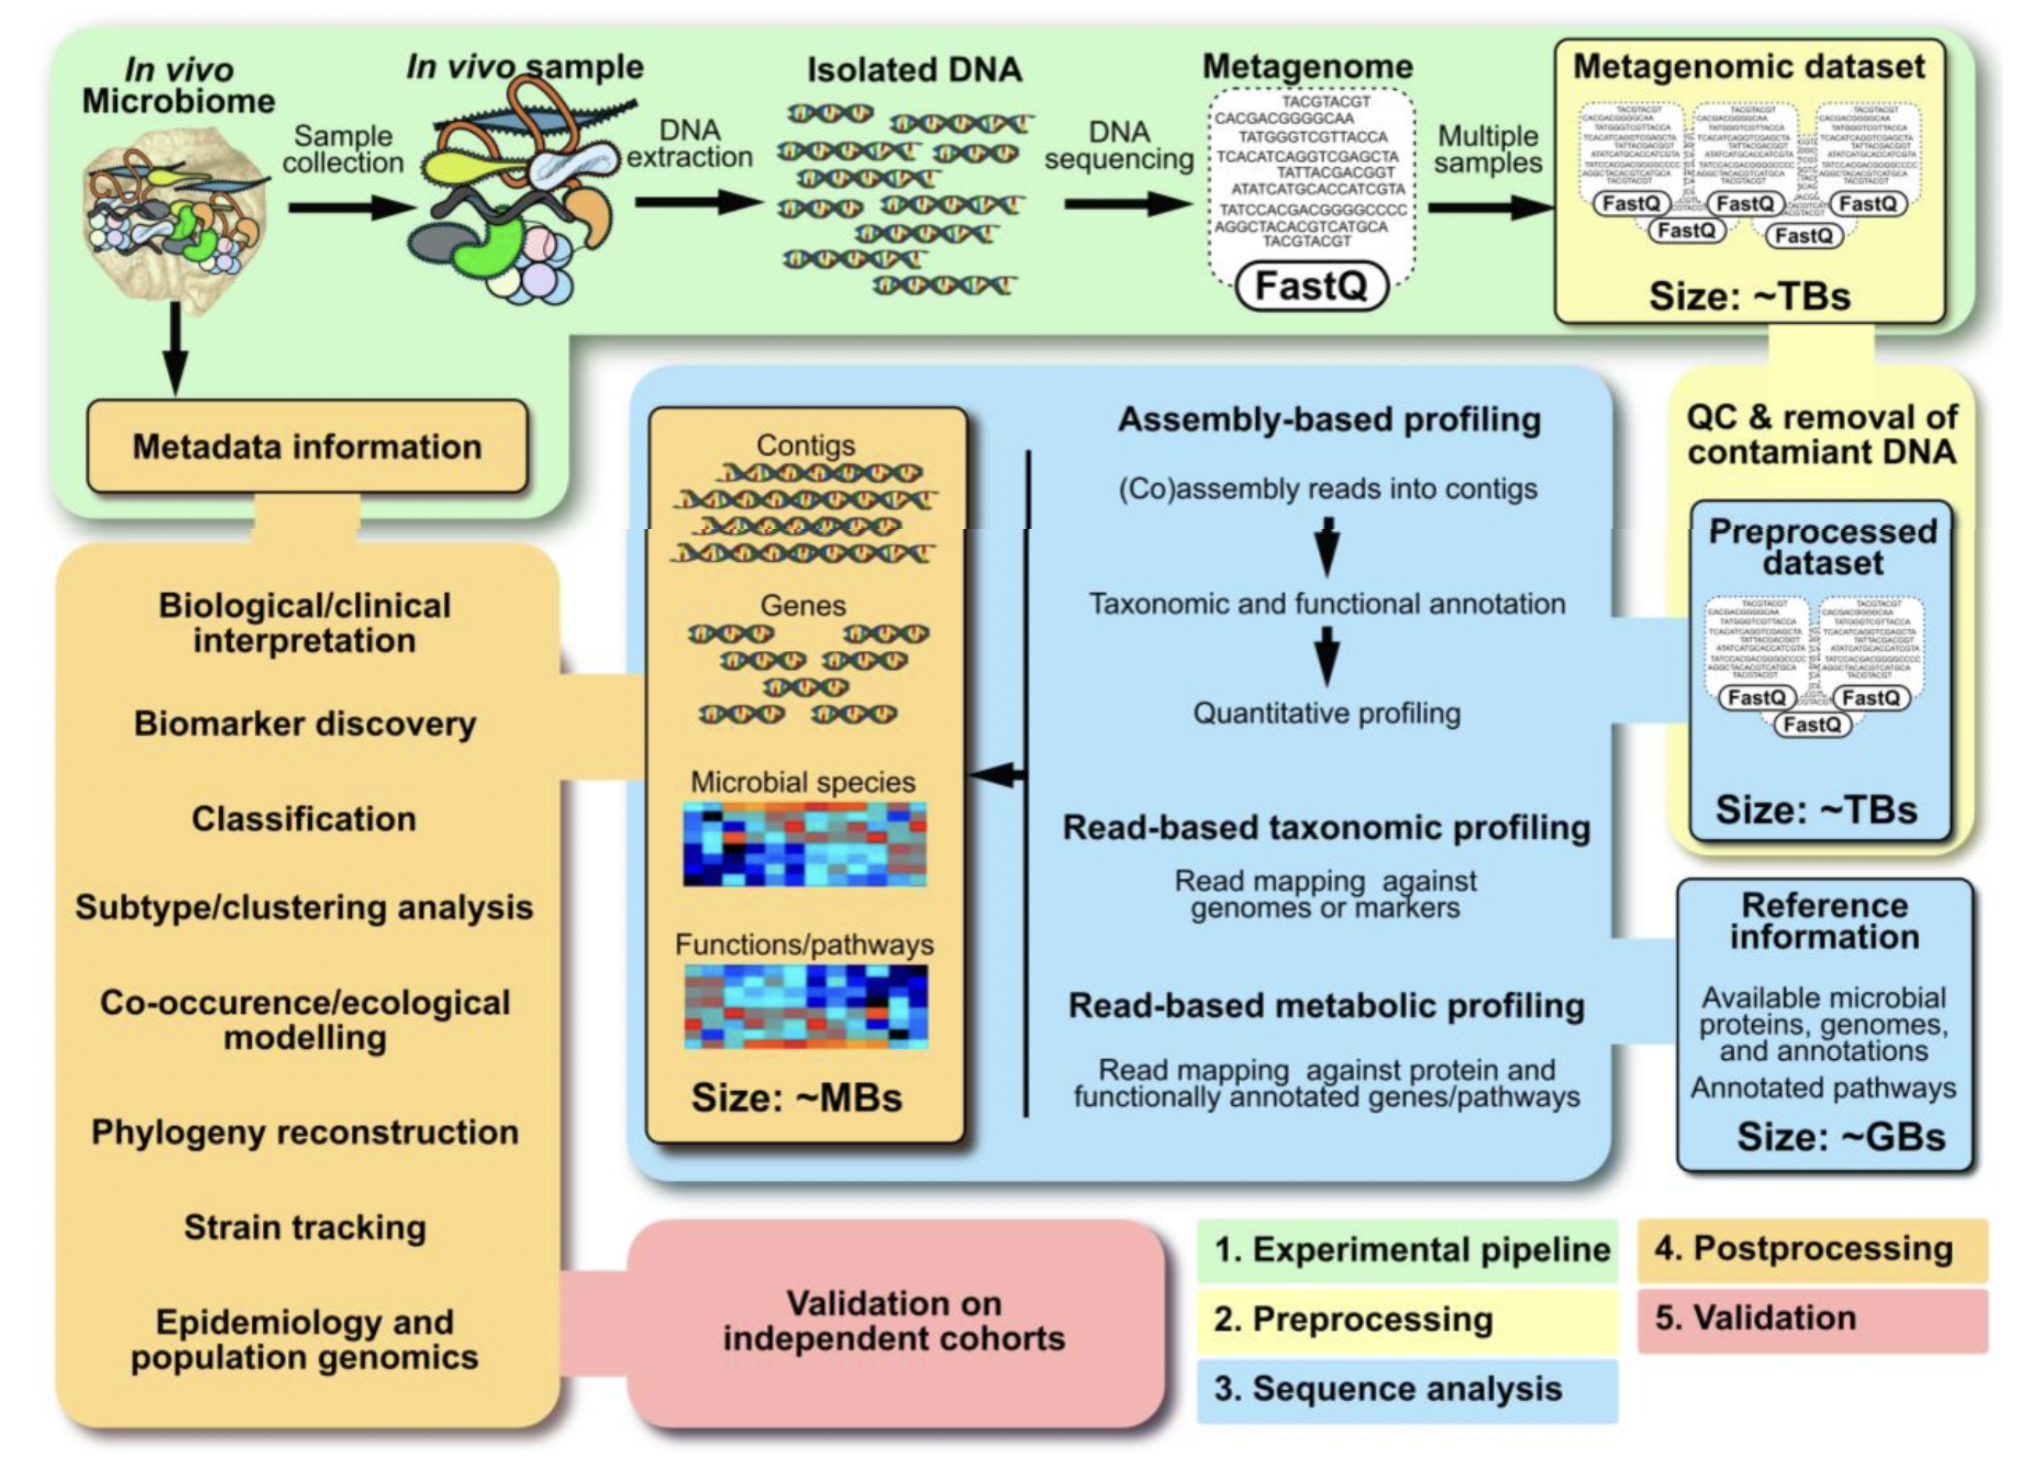
Quince, C., Walker, A. W., Simpson, J. T., Loman, N. J., & Segata, N. (2017). Shotgun metagenomics, from sampling to analysis. Nature biotechnology, 35(9), 833-844.
We will go over shotgun metagenomics more in a later chapter.
2.1.3 Amplicon-based Metagenomics
Amplicon-based metagenomics targets specific genes to understand which community members are present and to quantify community members (community profiling). Usually 16S or 18S are the genes that are amplified using polymerase chain reaction (PCR).
2.1.3.1 16S rRNA as an evolutionary chronometer
Case, R. J., Boucher, Y., Dahllöf, I., Holmström, C., Doolittle, W. F., & Kjelleberg, S. (2007). Use of 16S rRNA and rpoB genes as molecular markers for microbial ecology studies. Applied and environmental microbiology, 73(1), 278-288.
- Ubiquitous – present in all known life (excluding viruses)
- Functionally constant wrt translation and secondary structure
- Evolves very slowly – mutations are extremely rare
- Large enough to extract information for evolutionary inference
- Limited exchange – limited examples of rRNA gene sharing between organisms
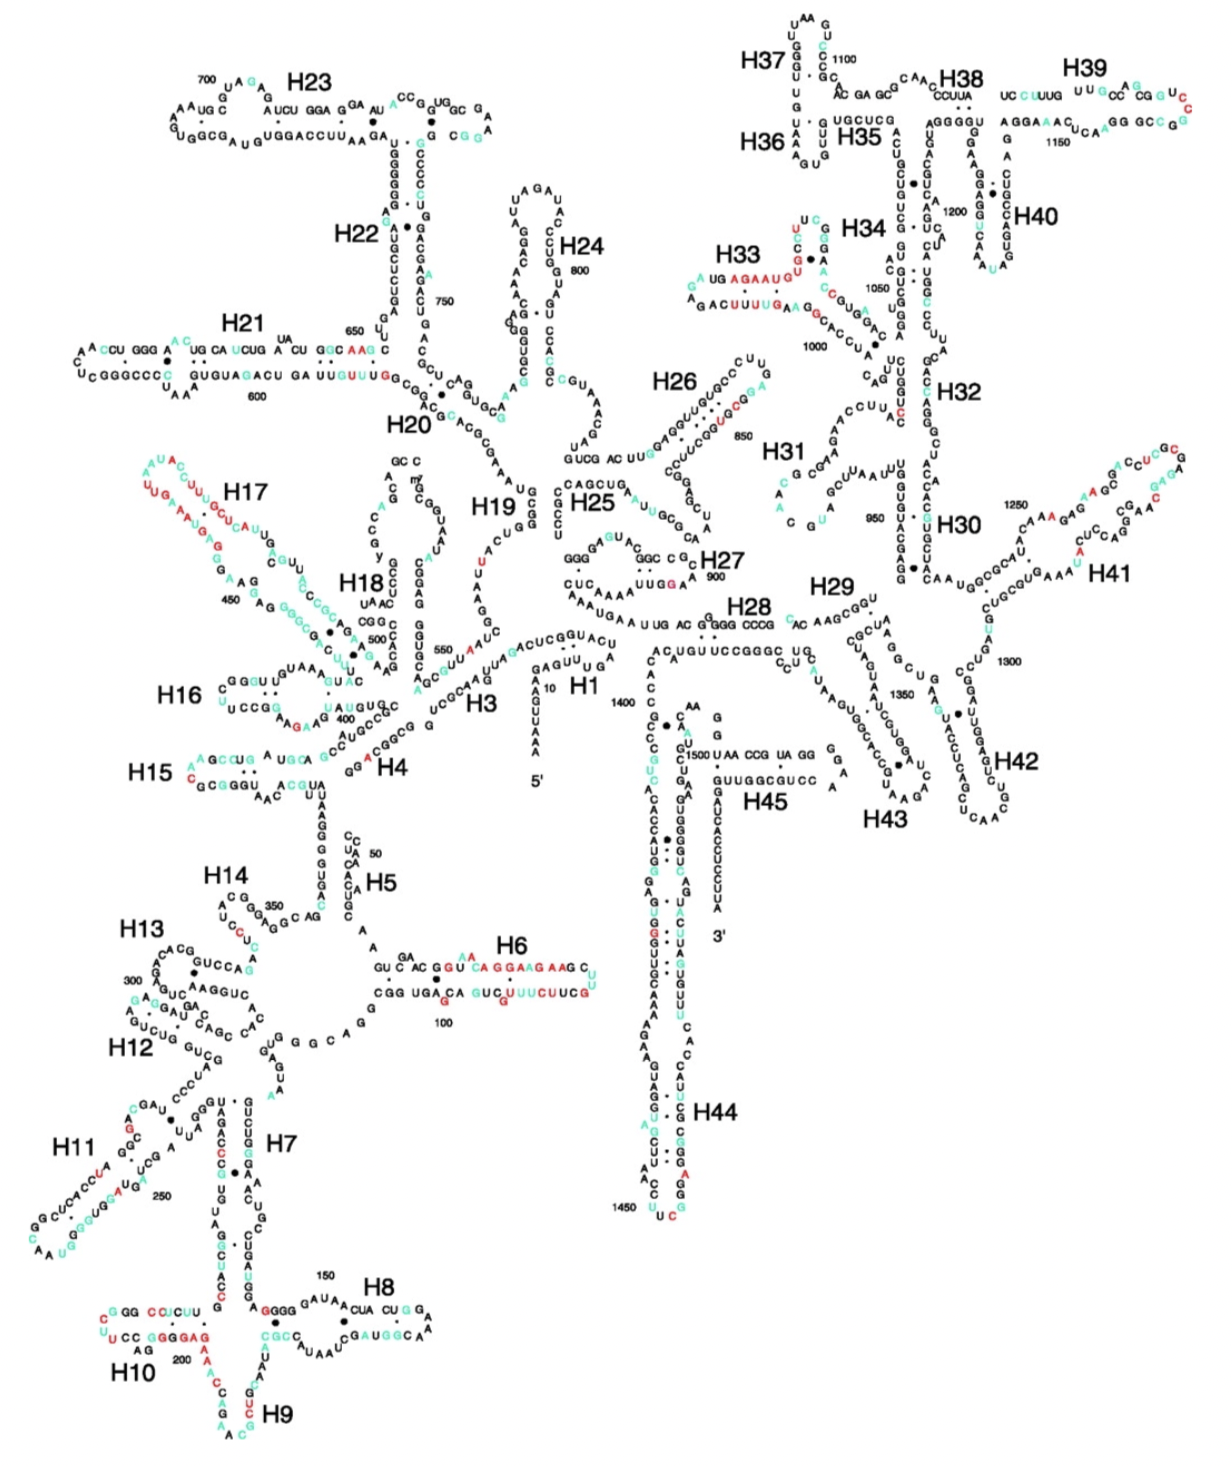
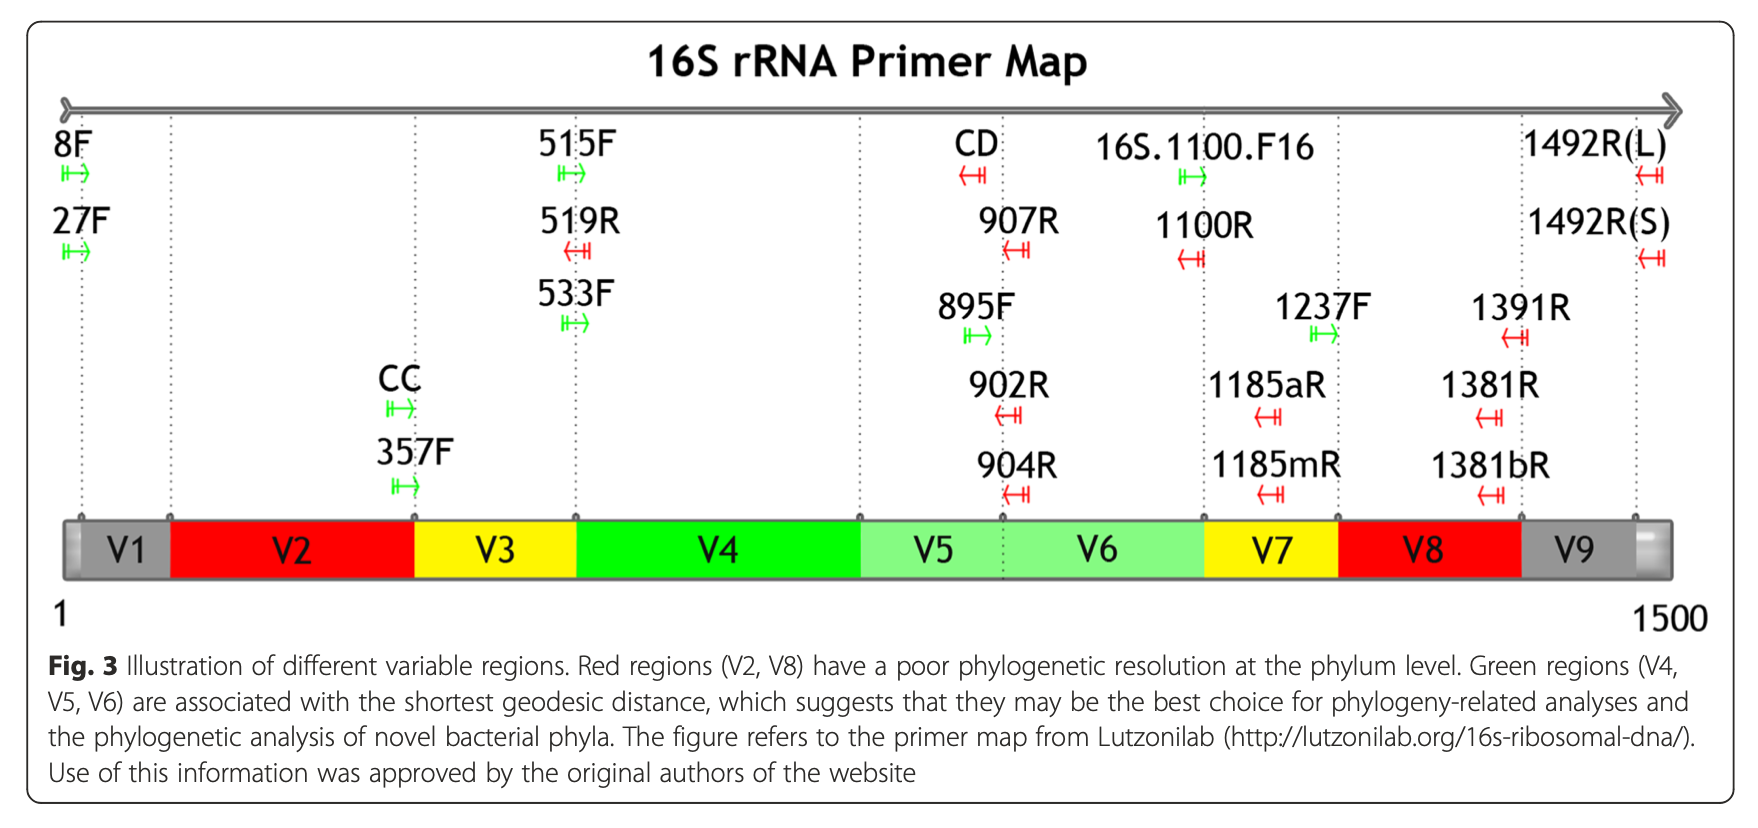
2.1.3.2 16S rRNA hypervariable regions
Yang, B., Wang, Y., & Qian, P. Y. (2016). Sensitivity and correlation of hypervariable regions in 16S rRNA genes in phylogenetic analysis. BMC bioinformatics, 17(1), 1-8.
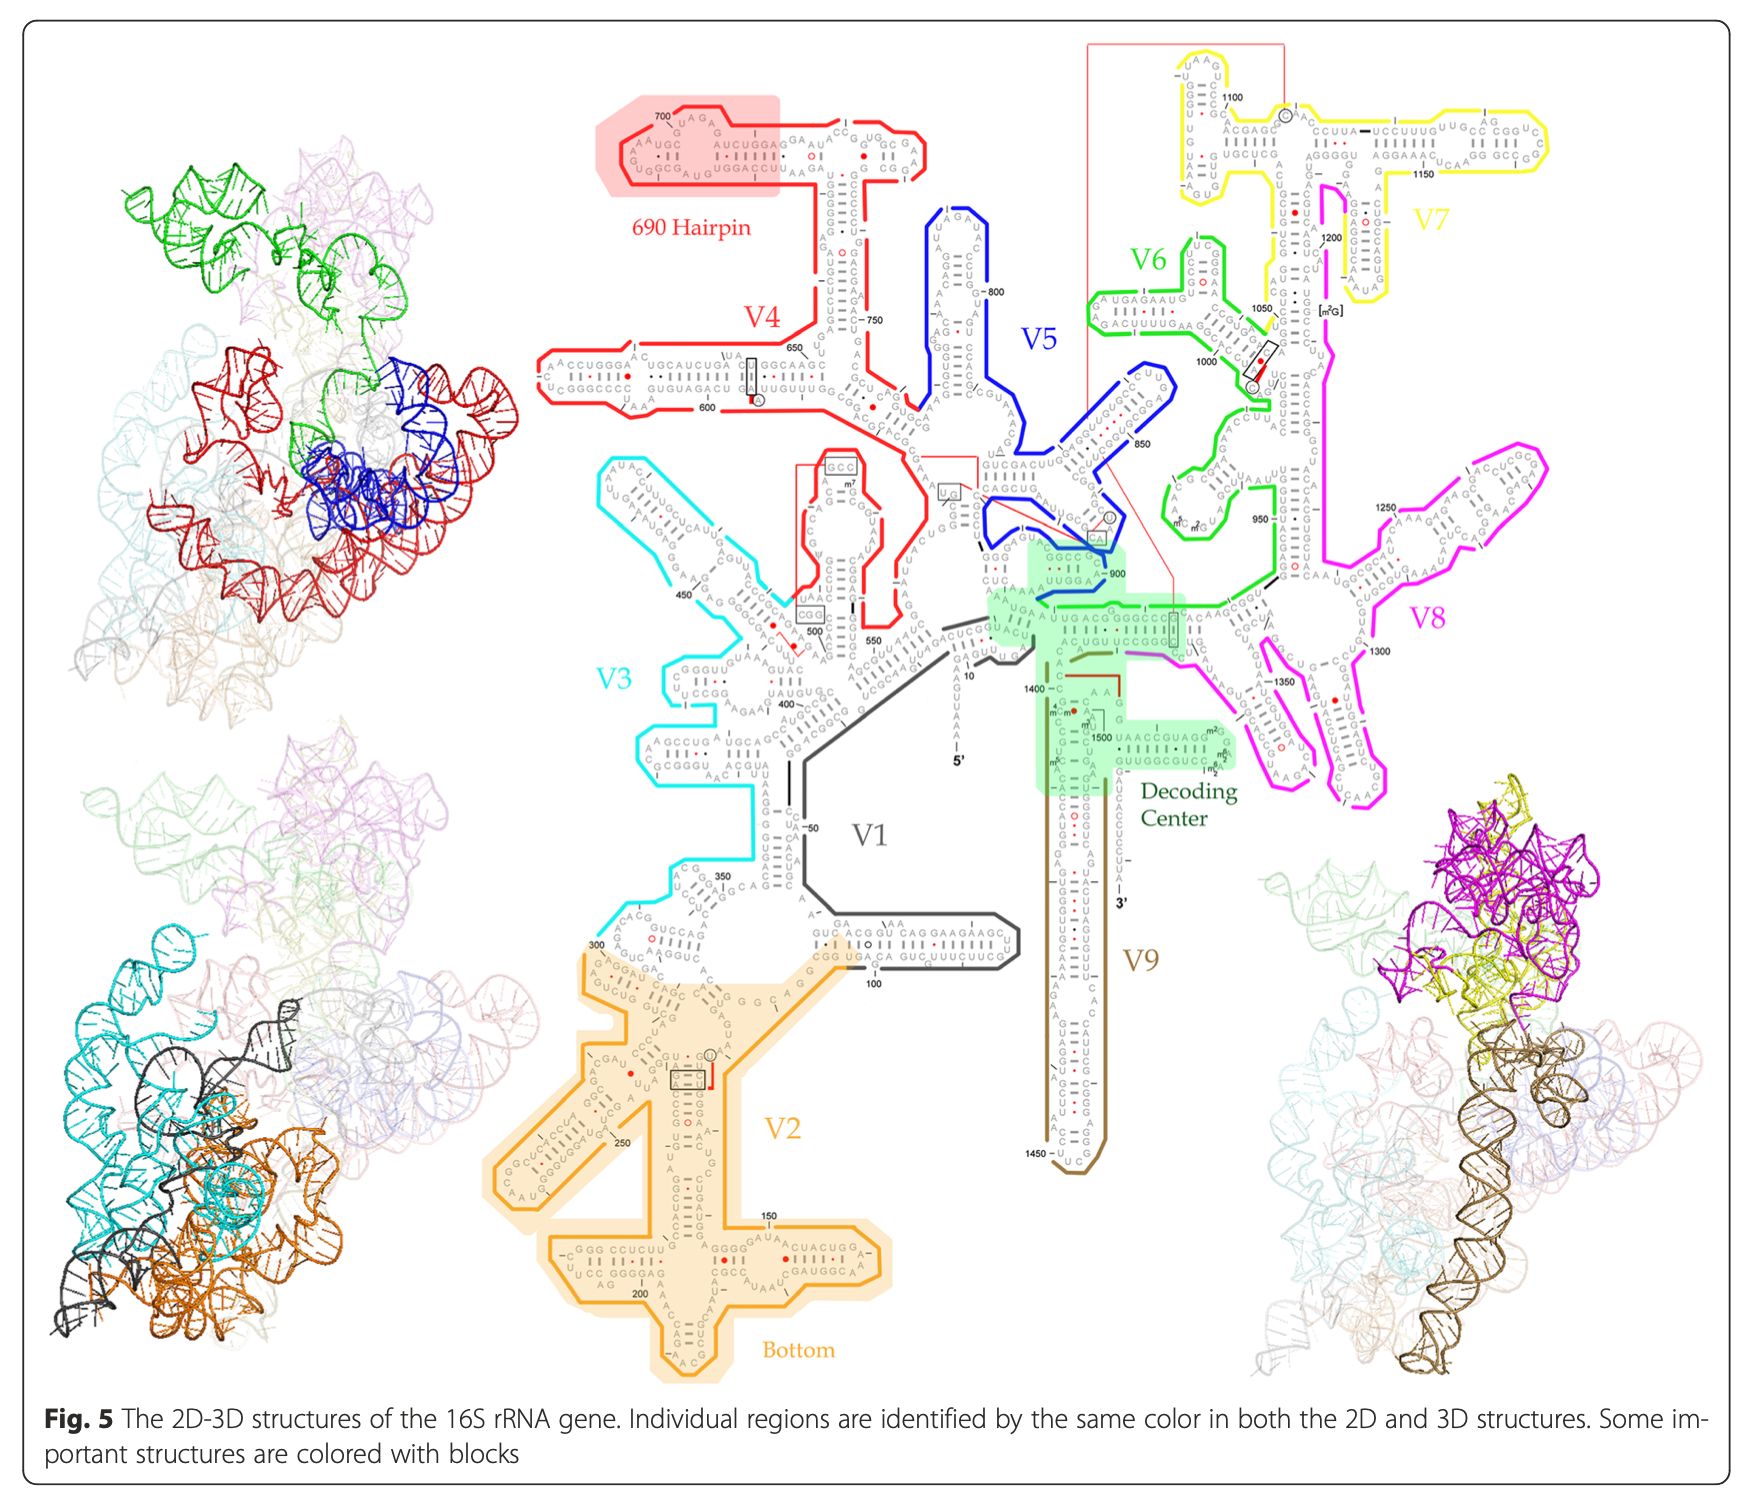
Yang, B., Wang, Y., & Qian, P. Y. (2016). Sensitivity and correlation of hypervariable regions in 16S rRNA genes in phylogenetic analysis. BMC bioinformatics, 17(1), 1-8.
Illustration of different hypervariable regions of 16S rRNA
2.1.3.3 Addressing the ‘fine print’ while generating 16S rRNA gene amplicon libraries
- Sample Collection
- Sample collection significantly influences the microbiome profiler after sequencing
- Sample storage
- DNA isolation
- Template concentration
- Template extraction protocol
- PCR amplification
- PCR bias and inhibitors
- Amplification of contaminants
J. Microbiol Methods (2018), App. Environ. Microbiol. (2014), Microbiome (2015)
2.1.3.4 Steps Involved
- Experimental Design: How many samples can be included in the sequencing run?
- By using barcoded primers, numerous samples can be sequenced simultaneously (multiplexing)
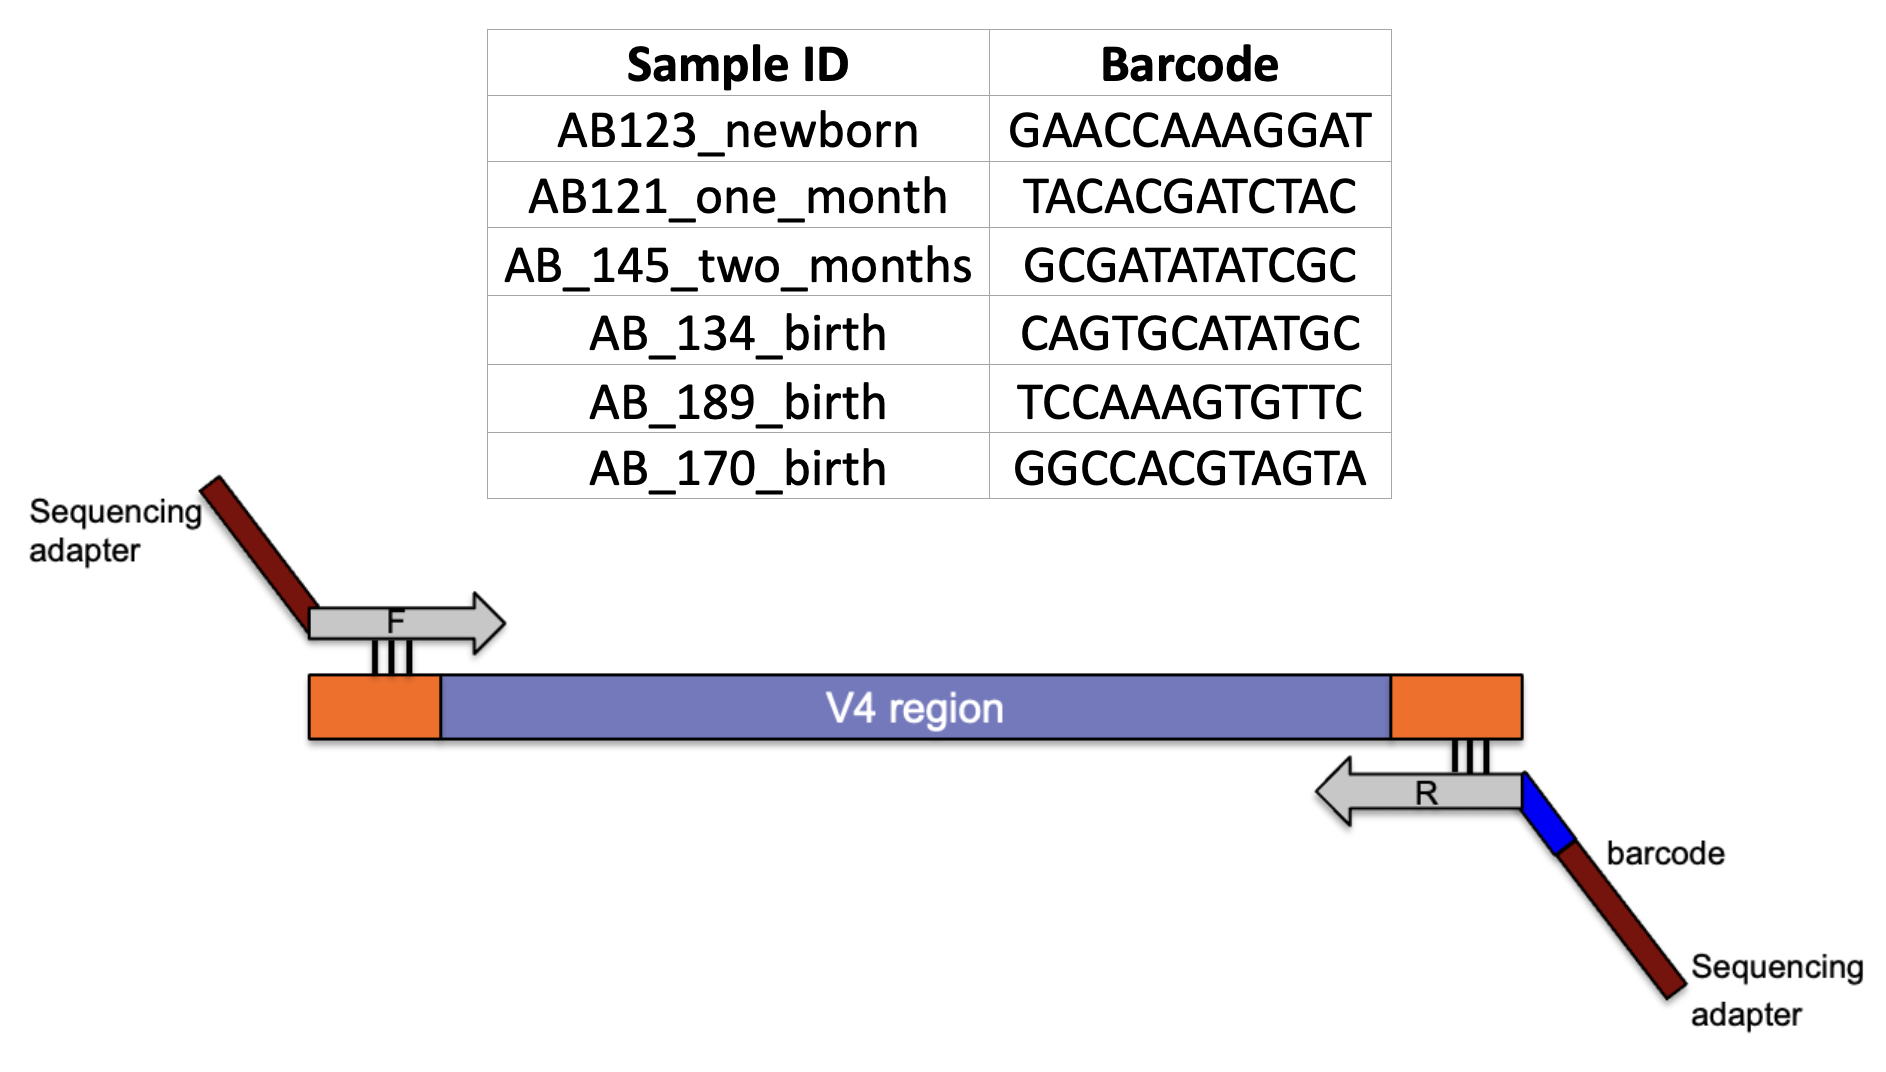
V4 Region
2.1.3.5 Samples
- More the number of samples, more cost effective the run (sequencing depth will be compromised)
Comparison of multiplexing capacity by sequencing system
- It is critical to have a ‘library prep manifest’ to document the position of each sample with its associated barcode along with additional metadata information
2.1.3.6 Include Controls
- Between run repeat (process any sample in duplicate per run to measure reproducibility across runs)
- Within run repeat (process any sample in duplicate per plate to measure reproducibility)
- Water used during PCR (water blank- to determine if any contaminant was introduced during PCR reaction)
- Water spiked with known bacterial DNA (mock bacterial communities- enables quantification of sequencing errors, minimizes bias during sampling and library preparation )
2.1.3.7 Selection of primers and region of 16S gene influence microbial profile
V2, V4, V6-V7 regions produced consistent results
- V2, V3 and V6 contain maximum nucleotide heterogeneity
- V6 is the shortest hypervariable region with the maximum sequence heterogeneity
- V1 is best target for distinguishing pathogenic S aureus
- V2 and V3 are excellent targets for speciation among Staph and Strep pathogens as well as Clostridium and Neisseria species
- V2 especially useful for speciation of Mycobacterium sp. and detection of E coli O157:H7
- V3 useful for speciation of Haemophilus sp
- V6 best target for probe based PCR assays to identify CDC select agents (bio-terrorism agents)
https://journals.plos.org/plosone/article?id=10.1371/journal.pone.0148047
2.1.3.8 Sources of contamination
- Kit or lab reagents
- Low biomass samples are vulnerable to contamination as there is less ‘real’ signal to compete with low levels of contamination
- Use ultraclean kits
- Include blank sequencing controls
- Cross- over from previous sequencing runs
- PhiX control DNA
- Human/ host DNA